Turn raw healthcare data into revenue growth and better patient outcomes.
Our brand-tailored AI agents autonomously surface hidden revenue opportunities and care gaps from deep repositories of claims, formulary, and reference data. You get a ready-to-present strategy, including a clear business case with specific HCPs, accounts, and payers to engage - no integration needed.

Why current analytics
fall short of strategy.
They only answer what you ask.
Dashboards and chatbots are reactive; they require you to have a hypothesis first. This leaves millions in untapped revenue hidden in the hundreds of questions no one has the time to ask.
They create work, not strategy.
Even great tools stop at the insight. You’re left doing the heavy lifting to validate, sharpen, and convince.
They lack defensible depth.
Insights are often surface-level and lack the granular, auditable evidence needed to survive a leadership review. They aren't built for the rigorous, "why-is-this-true?" questions that lead to real action.
Flyway Health
closes the strategy gap.
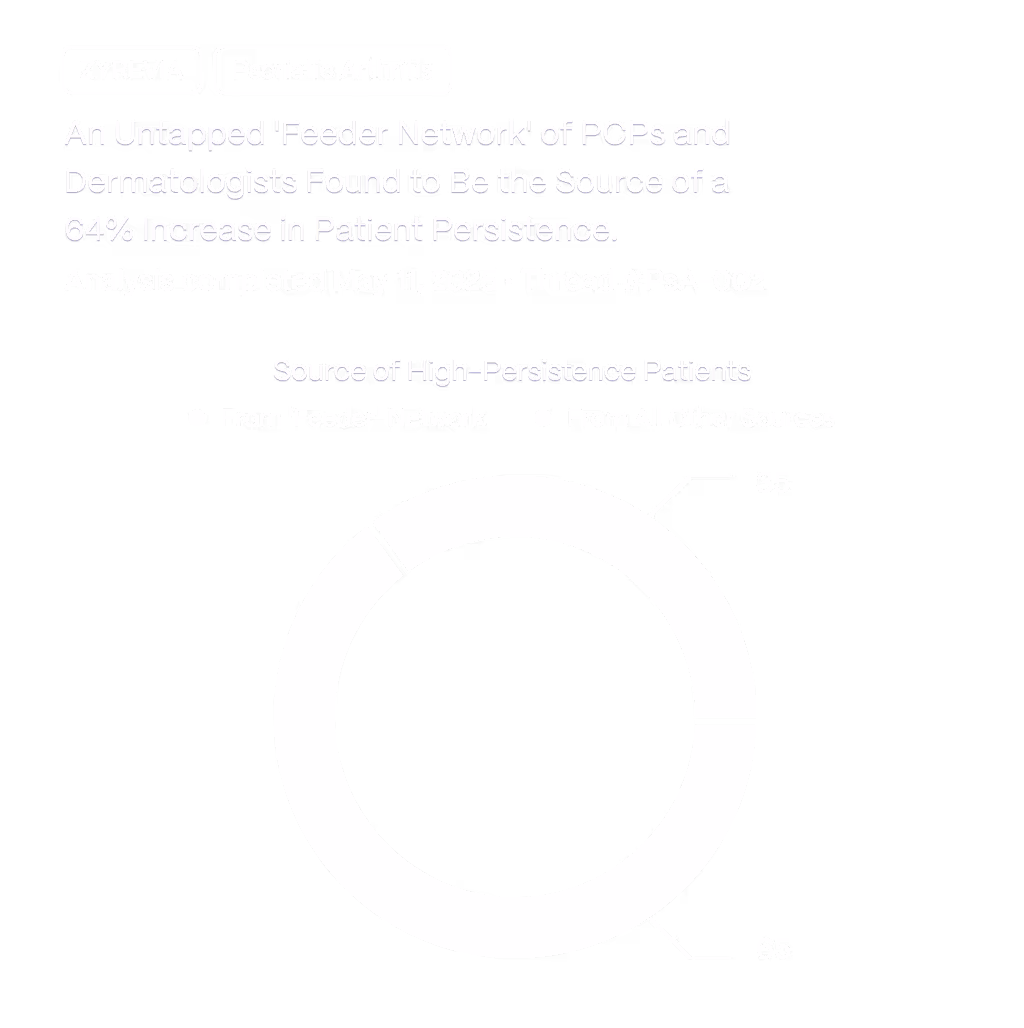
Find high-value opportunities without prompts.
Our agents autonomously explore millions of patient journeys in parallel, finding patterns no one thought to look for.

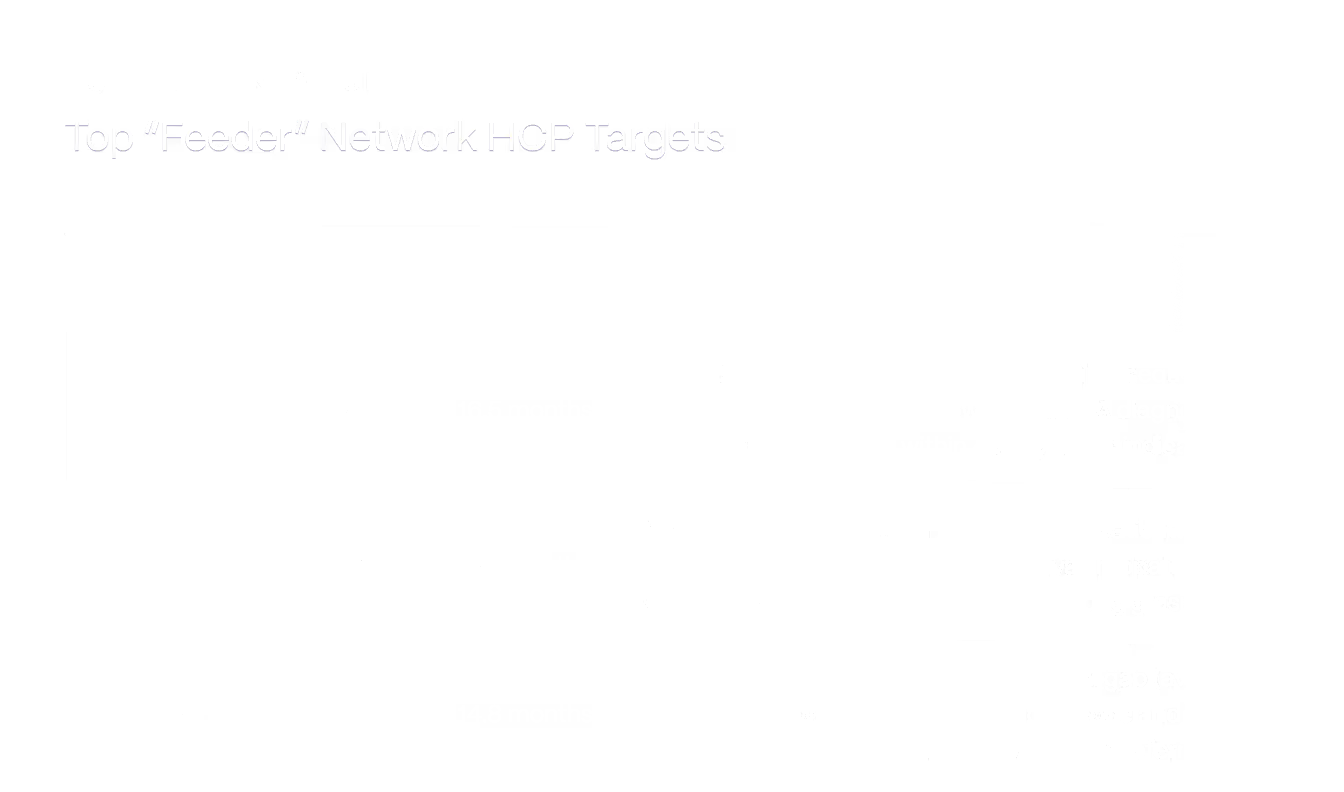
Precision down to the individual physician.
Flyway identifies the specific HCPs, accounts, and payers driving each opportunity, so you know exactly who to engage.

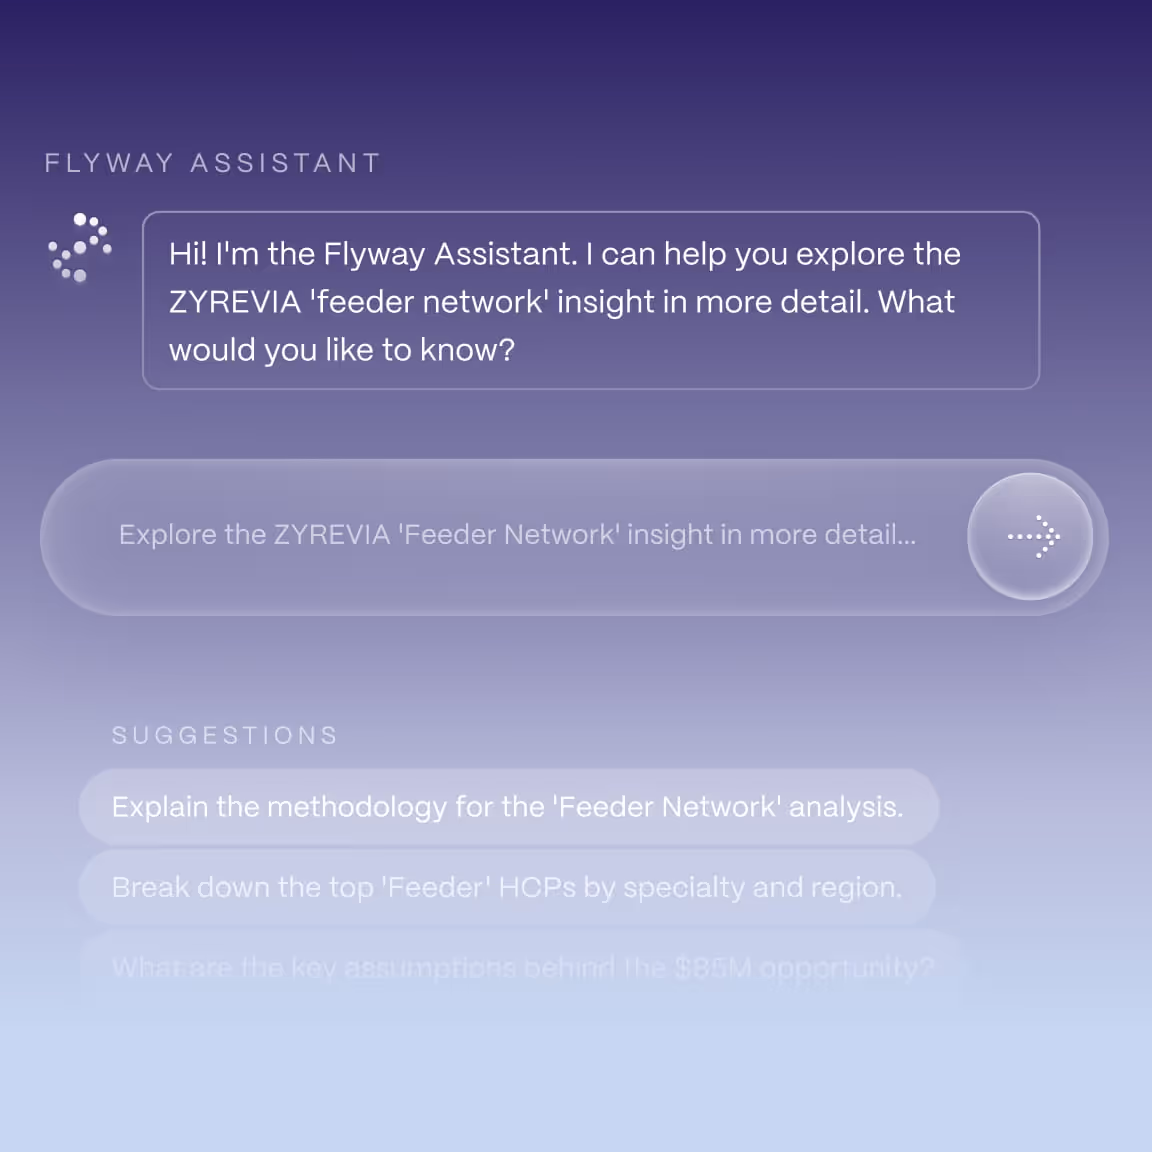
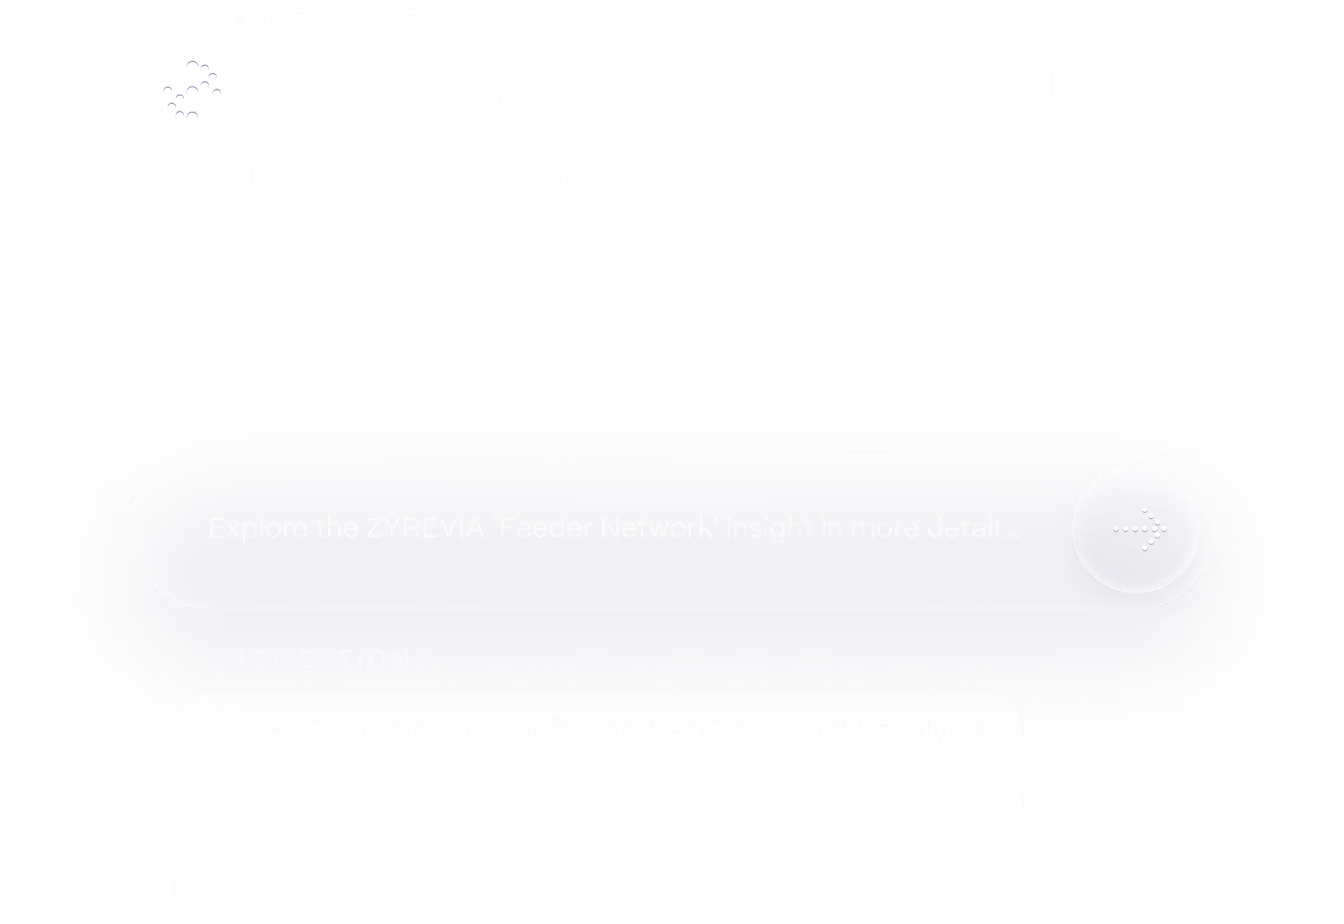
A built-in AI companion to interrogate every finding.
An intelligent assistant sits on top of your insight report, ready to explain the logic, clarify the methodology, and answer your toughest questions.
Get a defensible,
ready-to-present strategy.
Each insight comes with a quantified opportunity and a clear action plan, making it simpler to share, defend, and move forward internally.

Interactive Product Demo
From conversation to
strategy in three steps.
Our process is designed for speed and depth, moving from a single kickoff call to a fully tailored, on-demand platform for your brand.
Kickoff.
It begins with a conversation to understand your brand's unique challenges and commercial objectives. Because Flyway comes integrated with best-in-class data, this is a discussion about strategy, not a lengthy IT setup.
Select Your Tier.
Our agents align to your operational tempo. Choose Researcher for on-demand deep dives into your team's specific questions, or Sonar for 24/7 autonomous surveillance - surfacing risks and opportunities before they're obvious.
Continuous Intelligence.
Our agents immediately begin analyzing our integrated data - layering in your sources when you're ready - to deliver answers within 7 days. We become an extension of your team, answering known questions and hunting for new risks or opportunities each month. Say hello to your new Consultant-in-a-Pocket.
Specialized agents for
different commercial needs.
From pre-launch planning to defending in-market brands, Flyway identifies the strategic opportunities others miss, tailored to your brand and therapeutic area.
HCP Segmentation
Uncover overlooked prescriber segments by analyzing real-world treatment patterns, and identify exactly who to reach out to and why.
Patient Journey
Map how patients move between diagnoses, treatments, and outcomes - and reveal points of friction or missed opportunity.
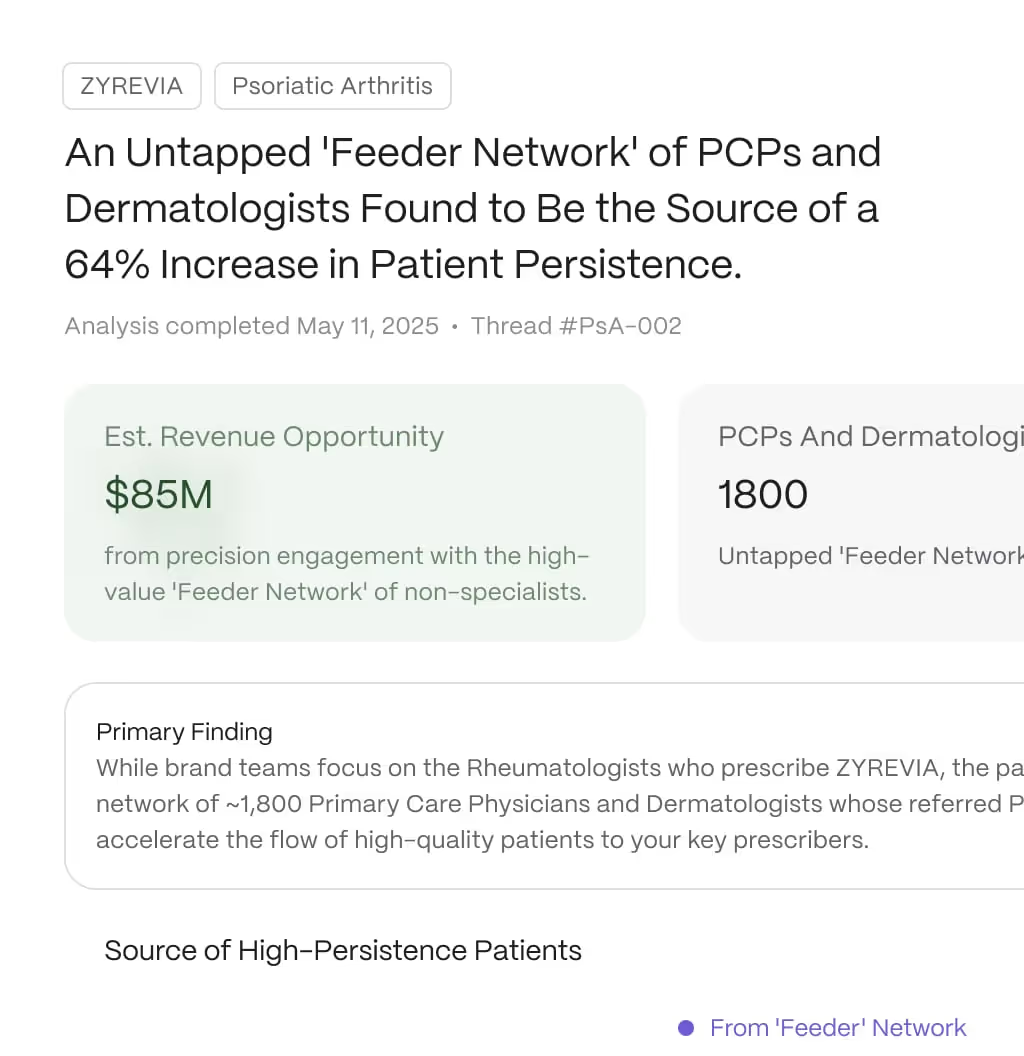
Persistence & Adherence
Identify what disrupts long-term therapy use, and uncover where to intervene earlier to increase treatment adherence and improve patient outcomes.
Payer & Access Strategy
Surface reimbursement bottlenecks and access issues, and understand what’s costing your brand revenue.
Trusted by leaders at the world's top pharmaceutical companies.
We partner with commercial teams at leading life sciences organizations to solve their most complex strategic challenges.
"Most platforms create more work for [my team]. They give us a data point, and we have to spend a long time figuring out the 'so what.' Flyway actually does the opposite. It delivers a leadership-ready narrative in one go. It's the first platform I've seen that actually closes the loop from raw data to presentations."
"My team mostly answers reactive questions from the business. [Flyway] answers questions we didn’t know we had. [Their] approach definitely changes our work from thinking about what just happened to thinking about what is going to happen, and what we are going to do about it. This is where the industry needs to go."
Advisors


Backed by

(now IQVIA Digital)
in Silicon Valley
(formerly Google Life Sciences)
FAQs
We can’t share our data due to internal policies. Can we still benefit from this product?
Yes. We come with best-in-class claims and formulary data already integrated - no IT lift required.
That said, our onboarding process is designed to absorb your team's knowledge: cohort definitions, business rules, primary research, and strategic priorities. This is how we ensure our outputs align with how your team already thinks and executes.
When you're ready to layer in proprietary data sources, we integrate those seamlessly in collaboration with your IT team.
How do we know your agent’s insights are accurate?
Every insight goes through a multi-stage validation process before it reaches you. But more importantly, we spend the first two weeks of every partnership in deep discovery with your team - absorbing your definitions, processes, business rules, and field context. This is how we align with how you already measure success.
Every deliverable includes transparent methodology and drill-downs. Your team can interrogate any detail via our built-in assistant - so you always understand the "why" behind every finding.
Is Flyway just for data scientists and analysts?
No. Most of our users are brand directors, commercial leads, and strategy teams - though we support data scientists as well.
Flyway delivers presentation-ready insights, not dashboards. You don't write code, manage pipelines, or build charts. You get meaningful answers.
What is your pricing model?
We work on tiered annual partnerships, priced per brand. For commercial teams, every partnership includes monthly Sonar monitoring plus Researcher deep dives - structured around your brand's tempo.
We also offer dedicated research capacity for cross-functional analytics teams. Reach out to learn more.
What kind of resources do we need to provide to make this successful?
During onboarding, we'll need 2–3 working sessions over two weeks to download your team's expertise. This is a one-time investment that calibrates our agents to your brand.
After that, the platform runs as a managed service. Our team stays close throughout the partnership to ensure every insight lands.
What therapeutic areas do you work in? Can you handle rare diseases?
We're therapeutic-area agnostic - primary care, specialty, oncology, vaccines, and rare disease. The agents are built to find signal even in sparse data.
Do you train your AI model on my company's data?
No. We don't train on client data - ever.
Each brand gets a dedicated, isolated environment. Your data is never co-mingled with other clients. The insights we generate are yours alone.
Can you incorporate additional data sources beyond claims and formulary?
Yes. Our agents come integrated with claims and formulary data out of the box. Upon request, we can layer in additional sources from our partner ecosystem - or integrate your proprietary datasets, primary research, and internal analytics.